Upload date
All time
Last hour
Today
This week
This month
This year
Type
All
Video
Channel
Playlist
Movie
Duration
Short (< 4 minutes)
Medium (4-20 minutes)
Long (> 20 minutes)
Sort by
Relevance
Rating
View count
Features
HD
Subtitles/CC
Creative Commons
3D
Live
4K
360°
VR180
HDR
865 results
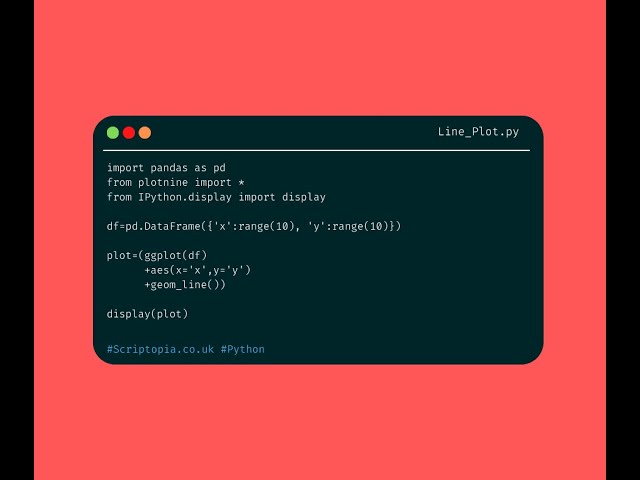
Today we learn about the Python package plotnine and how to use it to easily create professional visualizations in Python.
10,730 views
1 year ago
A grammar of graphics is a high-level tool that allows you to create data plots in an efficient and consistent way. It abstracts most ...
6,194 views
2 years ago
In this python tutorial, we will go over plotting (charts and graphs) with the plotnine package based on ggplot2 from the R ...
8,276 views
3 years ago
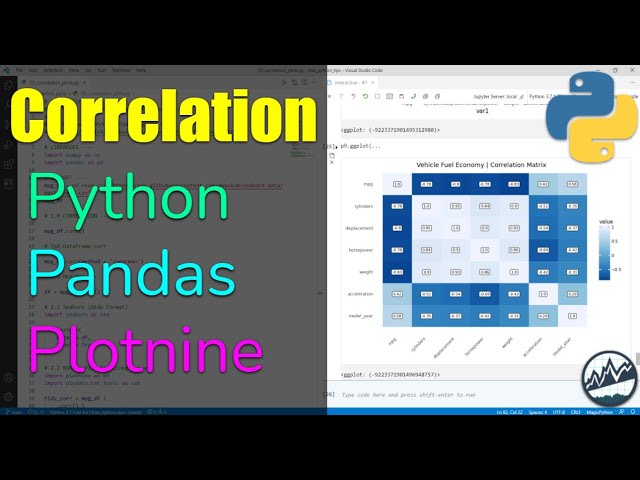
Correlations are an essential tool for data scientists. Everyone in business understands them so conveying correlations will make ...
1,991 views
Extend your visuals from R to Python by using plotnine and ggplot to create a bar chart, using the syntax of Grammar of Graphics ...
931 views
Ggplot for Python; Use ggplot and plotnine to make charts in Python In this episode, we're going to use ggplot and plotnine in ...
2,339 views
How to Create a Heatmap Using plotnine and ggplot in Python Plotting in Python is great and there are many ways to show a ...
665 views
The layered grammar of graphics provides a declarative way to produce graphs. The original and most popular implementation is ...
715 views
276 views
Presented by Hassan Kibirige {plotnine} brings the elegance of {ggplot2} to the Python programming language. Learn about The ...
655 views
6 months ago
This webinar is an introduction to layered grammar of graphics as implemented in the R ggplot2 library and the Python plotnine ...
477 views
In this video we run tidyverse R in Google Colab. R ggplot2 syntax is used to generate graphs. We also apply ggplot syntax in ...
912 views
Video Lecture from the course INST 414: Advanced Data Science at UMD's iSchool. Full course information here: ...
2,458 views
6 years ago
--------------------------------------------------------------------------------------------------- Code: https://github.com/martinbel/data-visualization ...
266 views
The purpose of this video is not to teach time series. It is just to walk through preparing data for plotting. If you find that this is ...
468 views
814 views
In this video we take a quick look at the Plotly framework in Python. At the end we compare it to Matplotlib.
93,375 views
#coding #pythonforbeginners #tutorial #development #learning #learntocode #programming #code #pythonprogramming ...
10 views
15 views
As part of our "PyLadies R-Ladies" series, we hosted another event with PyLadies Tunis and PyLadies Munich.! This time, we ...
583 views