Upload date
All time
Last hour
Today
This week
This month
This year
Type
All
Video
Channel
Playlist
Movie
Duration
Short (< 4 minutes)
Medium (4-20 minutes)
Long (> 20 minutes)
Sort by
Relevance
Rating
View count
Features
HD
Subtitles/CC
Creative Commons
3D
Live
4K
360°
VR180
HDR
2,894 results
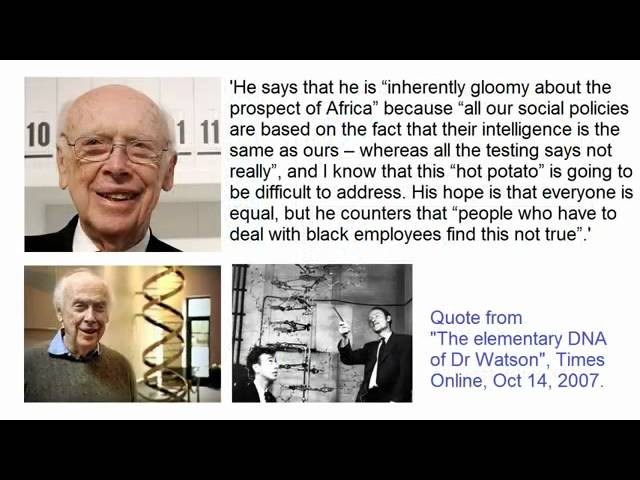
Hi there, this is not my work, I simply stitched the two parts of "The Science of Human Races" by c0nc0rdance together and ...
1,348 views
11 years ago
Learn about D3.js data joins, scales, and margins! Code: https://vizhub.com/curran/326730c80fc54969ae501fb58c8cb94b Part of ...
44,591 views
5 years ago
00:Heute bauen wir in dem Video eine Aktien Suche mithilfe der API von Lemon.Markets die als Sponsor des heutigen Videos ...
2,612 views
1 year ago
This is the seventh session of the Informatics and Statistics for Metabolomics 2014 workshop hosted by the Canadian ...
4,704 views
How you can realize comprehensive 3 way forecasting and planning? The Acterys forecasting engine utilizes Power BI and Excel ...
1,324 views
Welcome to the Ultimate Guide: IELTS Listening Tips! In this comprehensive video, we're going to uncover the secrets of ...
2,891,745 views
Title: Translating the International Climate Agenda to the National Level in Malaysia ...
2,222 views
8 years ago
Artist talk by Adam Harvey at the City Art Gallery, Ljubljana. Ljubljana, 20 June 2017 Realised in the framework of the exhibition ...
1,167 views
While “too much data” isn't really a thing, sorting through what is relevant to whom, what should be in focus at what altitude, and ...
16 views
4 years ago
0:00 - Intro 0:17 - Frequency 0:50 - Distributions 1:30 - Frequency Tables 2:15 - Grouped & Ungrouped Data 2:55 - Grouped ...
233 views
3 years ago
In this free webinar series, we cover the advantages and disadvantages of synthetic data. We explore the variety of methods ...
2,779 views
Clustered, variable width bar chart; scatterplot, dashboard (two charts side by side) with filters; print and save as PDF, then edit in ...
225 views
be warned the pdf file is big.
12,698 views
Presented by the Parsons School of Design/Cooper Hewitt Master's Program in the History of Design and Curatorial Studies.
2,598 views
2 years ago
Statistical graphics and tables More detail at http://hbiostat.org/bbr Offline discussion: ...
3,878 views
Streamed 4 years ago
In this video we take a close look at the problem of racial profiling, how it happens, and whether there are any ways in which it can ...
1,106 views
BrainHack School - Week 3 Day 1 - Agah Karakuzu's presentation on data visualization. Connect with Agah on Twitter: ...
266 views
Pat uses R to create a rug chart using ggplot2's geom_segment function and then sylizes the heck out of it to try to match an ...
1,388 views
239 views
Data shapes our world. W. E. B. Du Bois' pioneering data visualizations —currently on display in the exhibition Deconstructing ...
476 views
![Making a Bar Chart with D3.js and SVG [Reloaded]](/api/proxy/image?url=https%3A%2F%2Fi.ytimg.com%2Fvi%2FNlBt-7PuaLk%2Fsddefault.jpg)
![Profi Charts mit D3 selber bauen! Candle-Chart mit @lemon.markets & Nuxt 3 [Tutorial/Deutsch]](/api/proxy/image?url=https%3A%2F%2Fi.ytimg.com%2Fvi%2FGLe2sGgERjg%2Fsddefault.jpg)


