View
Tube
search
Sign in
Sign up
Subscriptions
Alessandra Alongi
DATAVIZ
3 views
36 items
Last updated on Feb 6, 2021
public playlist
d3Vienno
5:43
D3.js tutorial - 1 - Introduction
0 views
0
Venngage - Visualize your ideas
17:36
How to Make an Infographic in 5 Steps [INFOGRAPHIC DESIGN GUIDE + EXAMPLES]
0 views
0
AI Planet
1:05:36
Data Visualization & Diving Deep into Matplotlib
0 views
0
DataDaft
5:05
How To Make A Venn Diagram in R
0 views
0
The Rise Academy
7:55
How to create Chord Diagram using R | Data Science
0 views
0
DennisLal
12:51
From a fixed ggplot2 figure to an interactive Shiny App
0 views
0
InfoWorld
7:53
R tip: Drag-and-drop ggplot
0 views
0
Jonathan Ng
11:04
Build a Dashboard in 10 Seconds with R Shiny Flexdashboard
0 views
0
Melvin L
15:17
Plotly using R
0 views
0
Brad Williamson
3:29
Plotly Box plots
0 views
0
Frank About AI - Franklin Christuraj
1:59
15 Useful R packages for Data Visualization
0 views
0
InfoWorld
5:16
R language tip: Animations in R
0 views
0
Stat Pharm
6:03
Create an attractive online dashboard using R
0 views
0
Posit PBC
47:55
Shiny and R to Build Dynamic Dashboards
0 views
0
Quick Codes with Daniel
11:10
Data Visualization in R: Plotting Time-Series Data in ggplot2
0 views
0
Spencer Stout
11:47
"Esquisse" r package tutorial
0 views
0
Gustavo Mourao
12:41
Graficos com R (ggplot2, esquisse, hrbrthemes, ggthemes, ggThemeAssist, dplyr)
0 views
0
InfoWorld
6:49
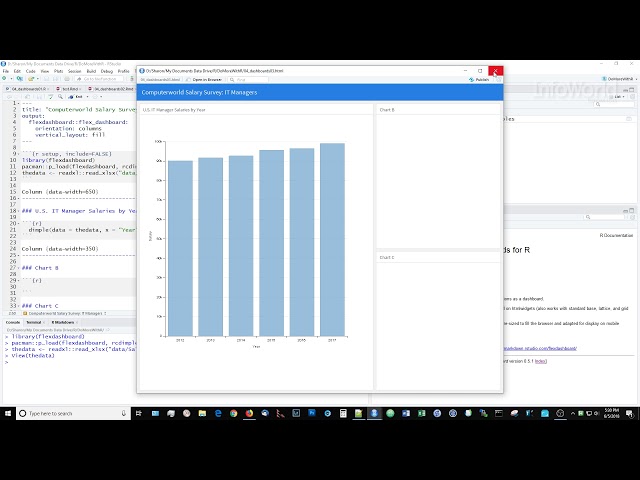
R language tip: Easy dashboards with flexdashboard
0 views
0
Dataninja
5:12
Data Visualization - Come usare Flourish per card interattive
0 views
0
Packt
2:23
Mastering ggplot2 : Waffle Chart | packtpub.com
0 views
0
ValQ
9:19
ValQ: Modern Visual Planning using Microsoft Power BI
0 views
0
Julia Silge
26:21
Topic modeling with R and tidy data principles
0 views
0
Julia Silge
51:34
Modeling hotel bookings in R using tidymodels and recipes
0 views
0
Data Science Dojo
1:11:15
Intro to Data Visualization with R & ggplot2
0 views
0
TECHtalk
5:16
R tip: Animations in R
0 views
0
Daniel Quintana
13:16
Improving your data visualizations
0 views
0
Pragmatic Works
15:02
Power BI Custom Visual - Tornado
0 views
0
Michael Toth
10:41
Guide to ggplot Colors: Working with Color Gradients for Numeric Data
0 views
0
Milos Gregor
4:50
Stagraph 1.1 - Data Visualization using the Grammar of Graphics
0 views
0
Microsoft Power BI
3:49
Using custom visuals - Waffle Chart
0 views
0
Charming Data
29:41
How to build Interactive Excel Dashboard with Python - Dash
0 views
0
freeCodeCamp.org
12:57:37
Data Visualization with D3.js - Full Tutorial Course
0 views
0
Bruce Mcpherson
6:52
Sankey Snip Google sheets add-on
0 views
0
Tech Know How
27:22
Sankey Diagrams - How to show customer migration in R!
0 views
0
Data Embassy
0:51
Tableau Mini Tutorial: Creating Sankey Chart in One Minute
0 views
0
1littlecoder
9:12
Easily make Dumbbell Chart using {ggcharts} | Data Visualization in R
0 views
0


![How to Make an Infographic in 5 Steps [INFOGRAPHIC DESIGN GUIDE + EXAMPLES]](/api/proxy/image?url=https%3A%2F%2Fi.ytimg.com%2Fvi%2FuQXf_d5Mgjg%2Fsddefault.jpg)